_edited.png)
23,000.00 |
Total Project Cost
BoreDM - The modern standard for subsurface data
BoreDM is a geotechnical data management platform that helps streamline the process of logging and analyzing borehole and laboratory testing data. It enables efficient, intuitive data entry and management for geotechnical projects.
ROLE
DURATION
TEAM
UX Designer
4 months
5 engineers, PM, CEO
PROJECT ACCOMPLISHMENT
Reduced data entry errors by 20% using AI and advanced filtering, based on 100 surveys.
PROBLEM
Borehole data entry is complex and error-prone, requiring engineers to manage large volumes of data with precision. The existing system is inefficient, leading to mistakes and delays in logging and testing
How can we simplify and streamline this process to improve accuracy and efficiency for engineers?

Creating a Geotechnical dashboard to monitor project progress, track materials used in each project, and ensure everyone has access to the same project information.
SOLUTION

FIRST STEP
First, I spoke with the PM to review the existing data and get a clear understanding of where things stand.
It turns out he’s spent the past year talking to consultants and experts in this field, and he recorded all of those conversations.I started by watching the recordings and taking notes on the key points that were relevant to the question I was trying to solve. After that, I organized and categorized the information on a Miro board to help identify common themes and patterns
Competitive Analysis: Gaining Insights from Industry Strategies
Next, I initiated a competitive analysis, looking at companies with similar products to see how they approach the same challenges. This helped me compare strategies and gather insights on what’s working in the market.

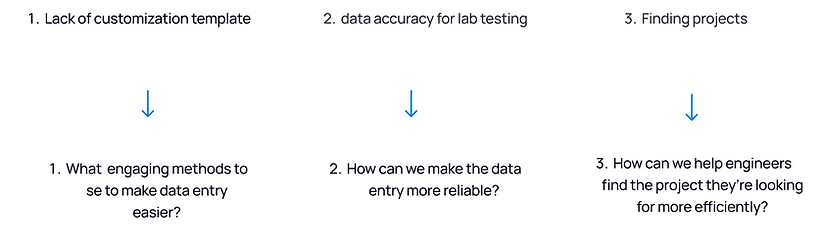
RESEARCH INSIGHT
Lack of customization template - A lot of consultants mentioned that engineers tend to have inconsistent data entry, which means you often have to go back and fix errors. This increases manual work and wastes more time overall.
Data accuracy for lab testing - It highlighted that engineers can make mistakes with data entry in lab testing. Common errors often include mislabeling samples or misinterpreting test results, which can lead to costly consequences.
Finding projects is time-consuming - One engineer may often juggle two or three projects simultaneously, making it challenging for them to quickly find and select the right geotechnical projects and view the details. This can be time-consuming, increase the risk of errors, and lead to delays.
OBJECTIVE
How can we improve their experience?
Brainstorming and Solution Evaluation with CTO and Engineers
Facilitated a Brainstorming Session with CTO and Engineers to Explore Solutions: Each Solution Reviewed for 15 Minutes, Followed by Individual Presentations of Favorite Choices and Rationale

01
02
03
Keeping data dictionaries organized helps structure information, but it can be a challenge to keep them updated.
Using standardized templates makes data entry easier for engineers and reduces errors, while AI can step in to catch mistakes in real time. By applying these strategies to research insights, data management becomes more accurate and efficient.
Regular audits are great for catching inconsistencies, though they can take a lot of effort.
Exploring the template idea
So I started brainstorming different ways to display the template page functionality:
First, I designed it as a pop-up where users could enter their information and view the template in a separate window.
Second, I positioned the template at the bottom of the page, allowing users to input data while keeping the template visible in the same view.

Feedback
After that, I had a call with the PM and engineers where we discussed two key points:
-
Increasing the number of user interactions (clicks).
-
Adding more functionality to the bottom section of the page.


Task flow for lab testing
Created task flows for each process to help designers and developers understand user interactions with the system and identify user needs at each step.

Final Designs

SOLUTION#1
Implement customizable templates for data types
Engineers can effortlessly input or select relevant information without starting from scratch, using filters to streamline the process and minimize errors, significantly boosting efficiency. This allows them to focus more on their core responsibilities and less on data management, leading to faster project completion

SOLUTION#2
Tracking Lab Testing
We link samples to their corresponding borings and depths, enabling engineers to trace test results back to the precise location and depth of each sample. Additionally, we integrate AI to automatically detect any anomalies in lab tests, identifying results that deviate from typical patterns.

SOLUTION#3
Enhanced Project Locator
Engineers can easily search for their projects on the map by entering the location or latitude and longitude, or by selecting a project type, such as governmental, current, or other projects. This streamlines project identification, allowing engineers to quickly access the necessary data, minimize search time, and ensure they are working with the most accurate and up-to-date information.

SOLUTION#4
Lab Tests
To ensure engineers can easily access the most recent laboratory test results for all ingredients presented in two views: a list view for a quick overview and a table view for detailed information on each ingredient
.png)
Business Metrics
Following the design implementation, user retention after the free trial increased, and more people signed up after demos. After a few months, I spoke with engineers who shared that being able to enter data directly in the field saved them 5 to 10 hours per week, time they previously spent returning to the office to input data. Data entry errors were reduced by 40%, significantly improving the accuracy of recorded geotechnical information

More Feedback

After our first sprint, when the designs were ready for the engineers to use, I made sure to reach out and have conversations with them to gather feedback. I asked about their experiences with the new flow, which helped me identify areas for improvement. This feedback loop guided me in making additional edits to enhance the design for our next iterations.

Learning
Identifying Traget User
Think about who will be using this in the field and what they need. For those handling equipment or navigating tough conditions, it's crucial to optimize spacing and button sizes to ensure they can interact with it effectively.
Working Crossfunctionally
Understanding the needs of end users is crucial. When collaborating closely with the engineering team, you gain early feedback and insights into technical constraints, facilitating the creation of more effective designs.
Gathering Input early
Working closely with stakeholders and end-users upfront ensured that the dashboard aligned with their expectations from the start, preventing us from going too far down the development path without course corrections
Not taking things personaly
Getting feedback as a designer is crucial; it's essential to not take things personally but rather view them as opportunities for improvement and growth.